Activity and sleep
To view your activity in the charts, make sure to Synchronize data first. Then tap the Charts icon on the home screen to access activity charts. Tapping one of the daily statistics on the home screen will bring you directly to the relevant chart.
Charts
Here is a list of charts and their explanations that Gadgetbridge provides for your gadget.
Available charts may vary to the gadget
Because each gadget can provide different types of data, the graphs you see on the activities screen may vary. Also, if you're using a gadget that doesn't have capability to track activities (non-wearable devices, such as headphones), you won't be able to see any of these charts.
Activity summary
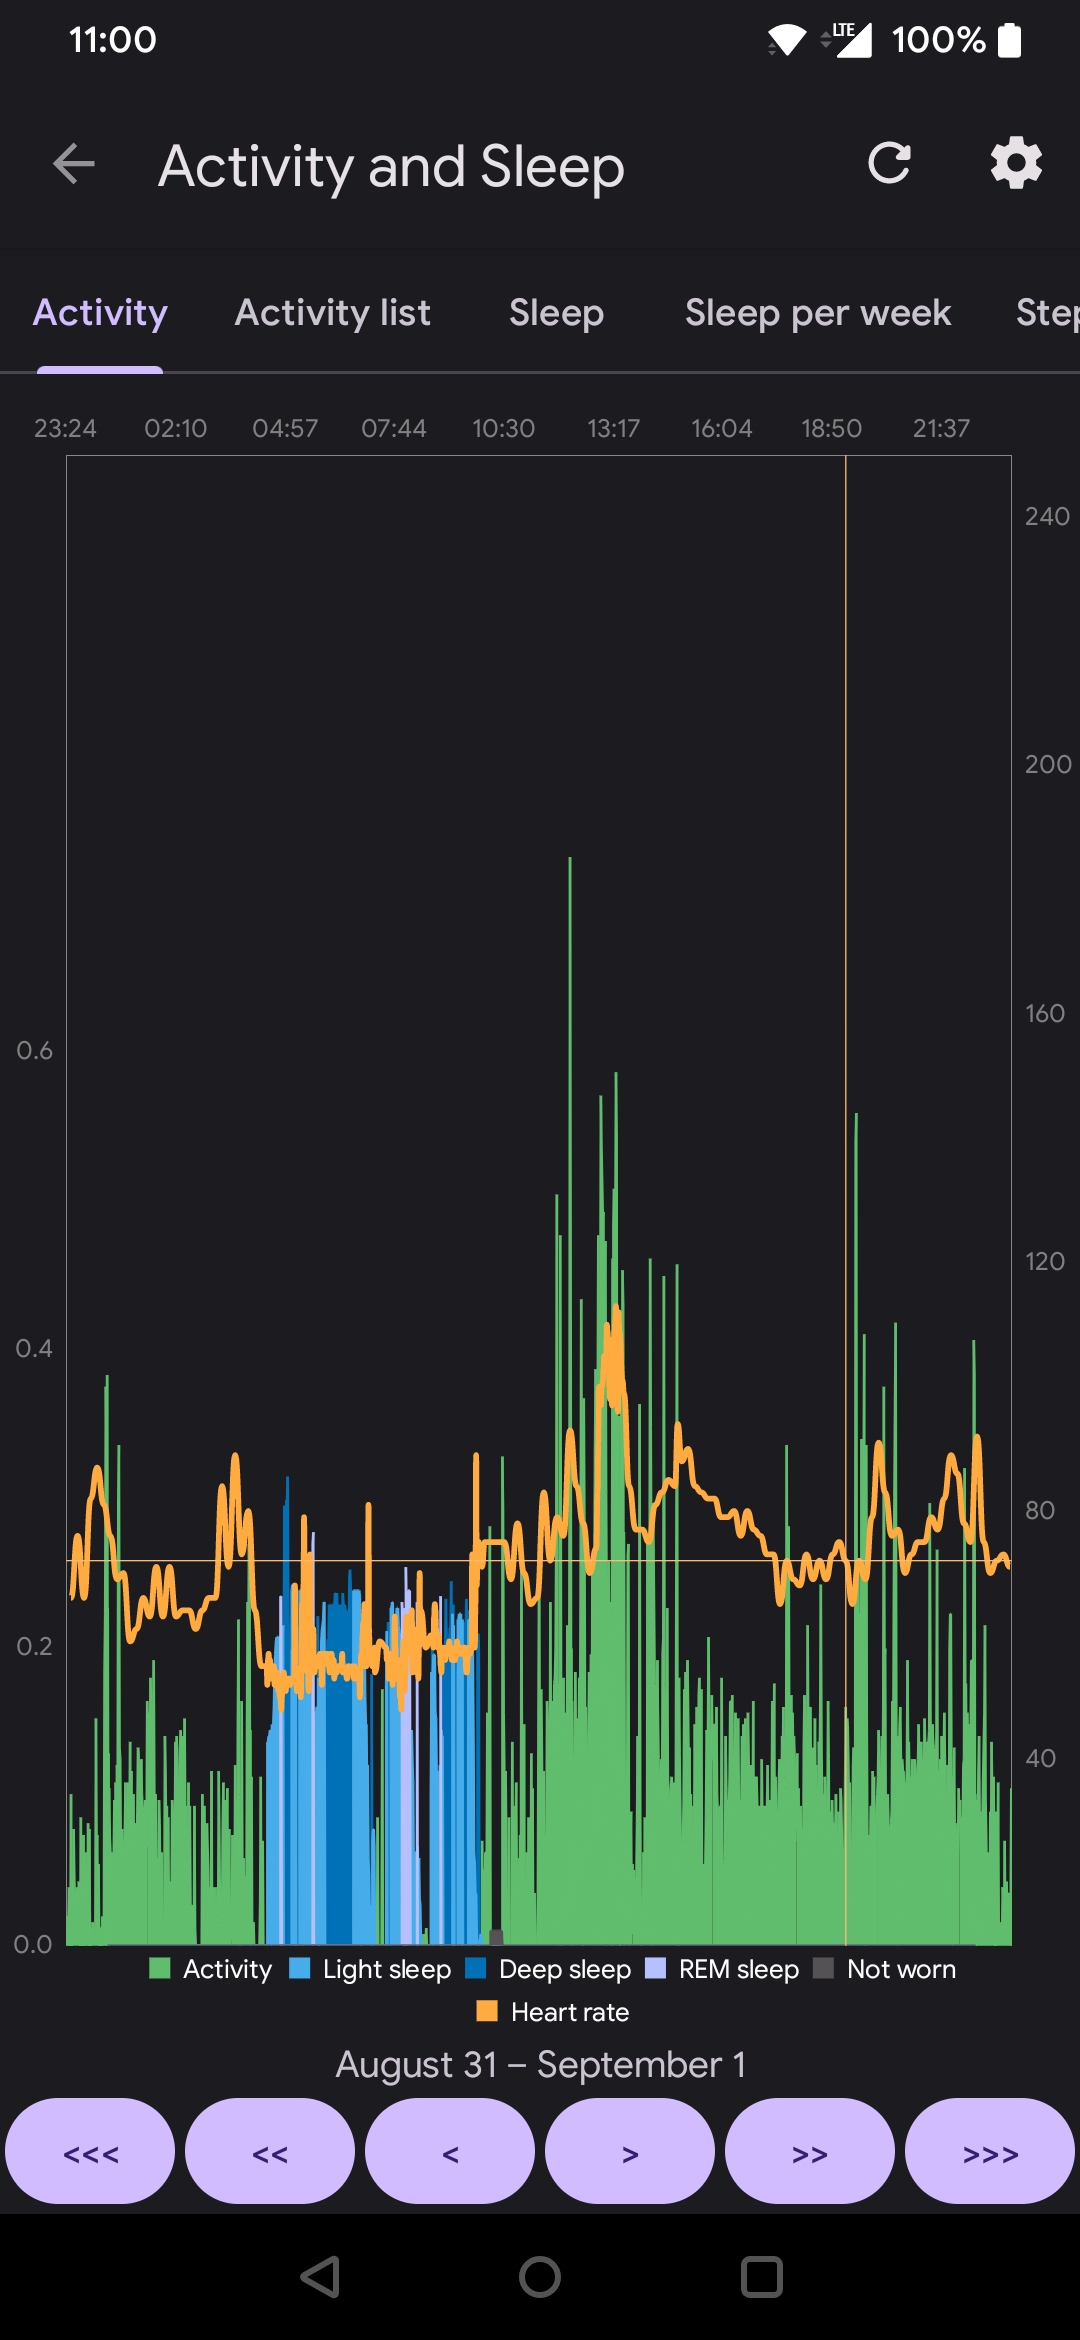
This tab displays activity intensity (movement) on Y axis (green during the day, blue during night), heart rate on Y axis (orange), time on X axis.
Activity list
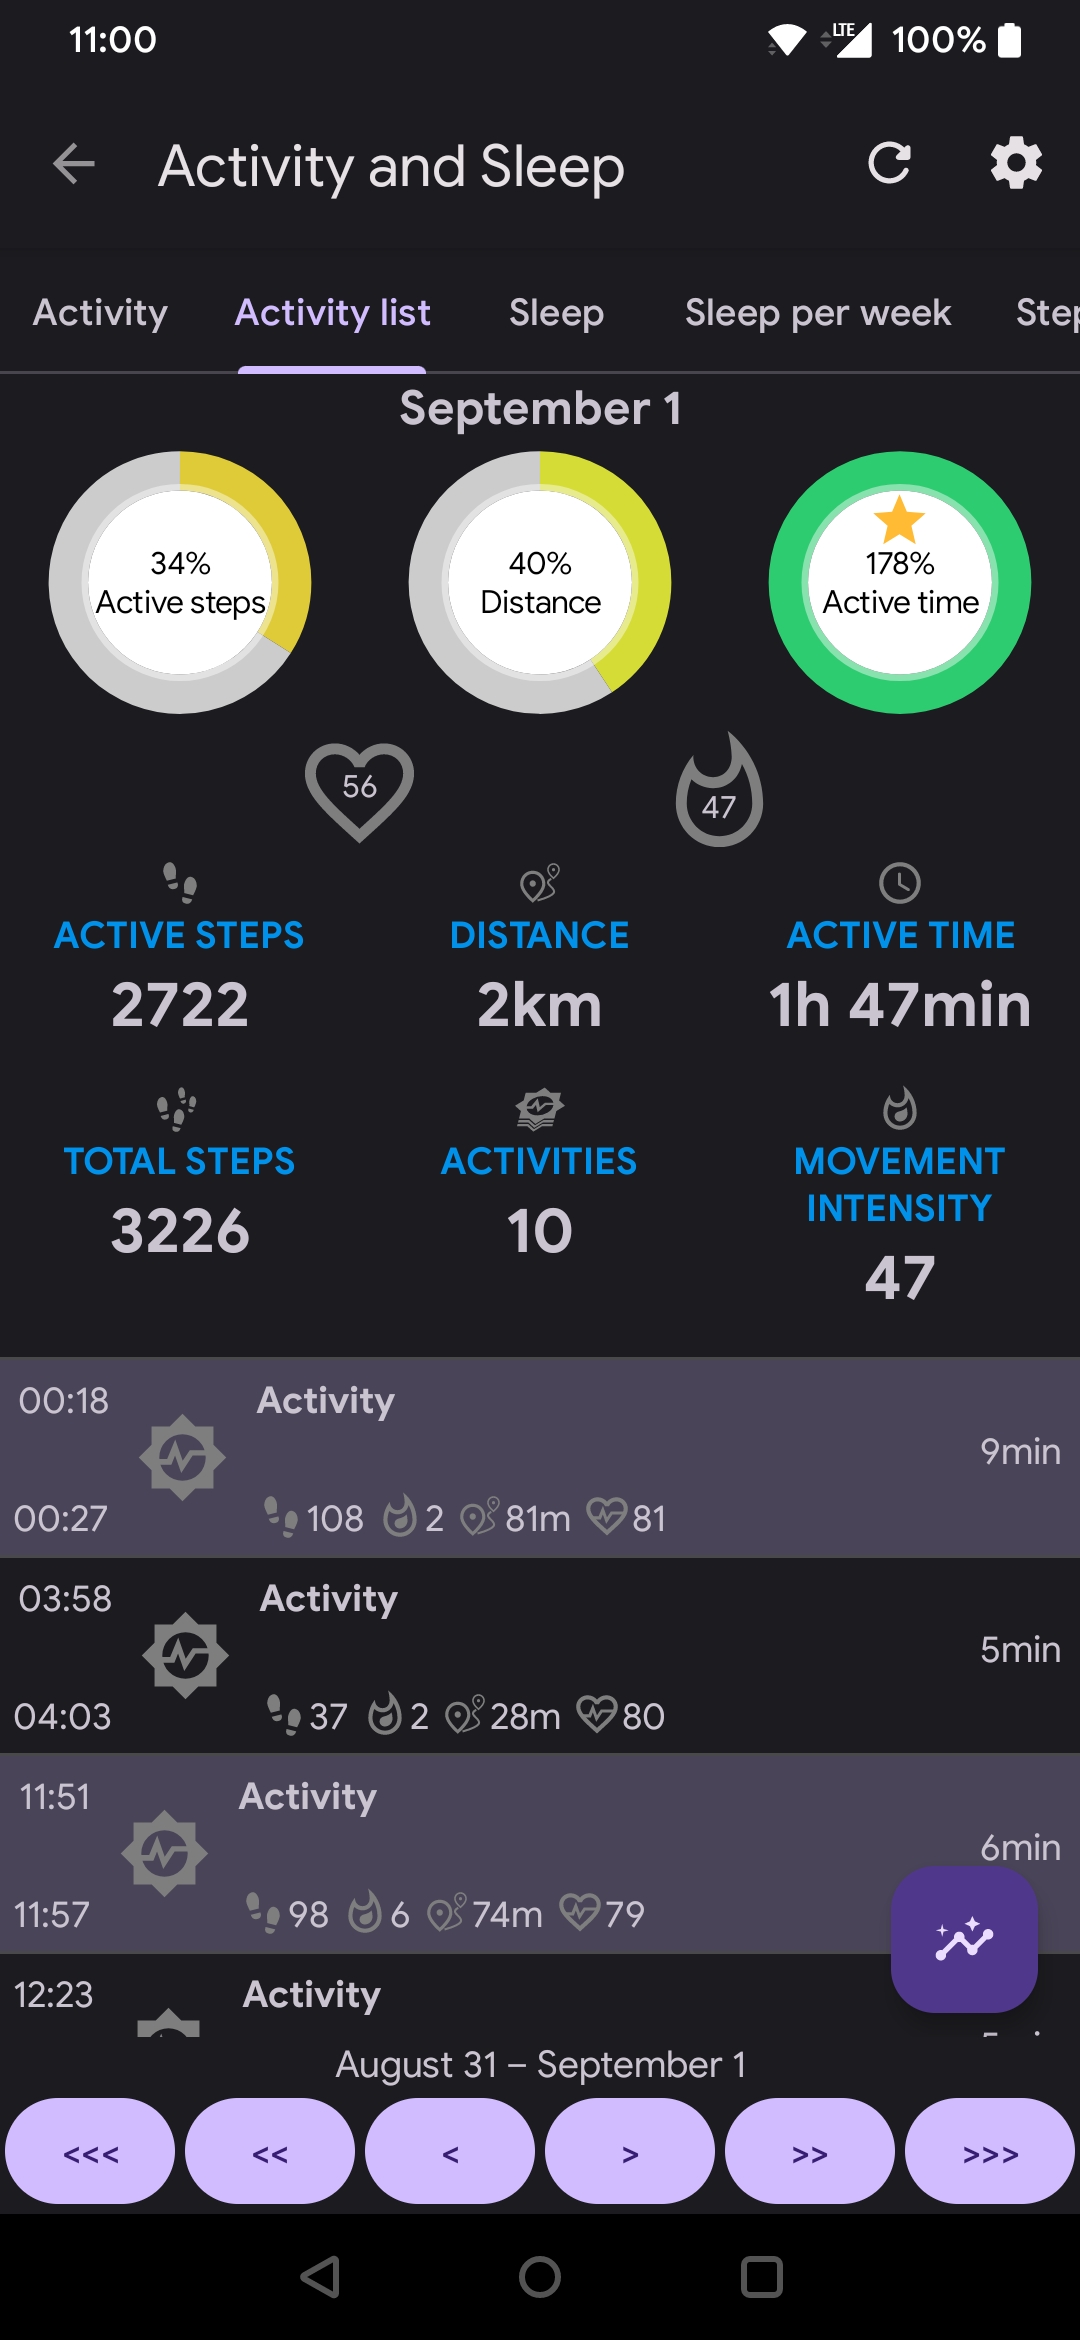
This tab in charts allows observing and analyzing your movement/activity sessions throughout the day without having to turn on activity tracking feature on the gadget.
Make sure to adjust your personal settings and goals, available in the global settings menu under "Settings → About you" and from the current screen top right button Settings → About you.
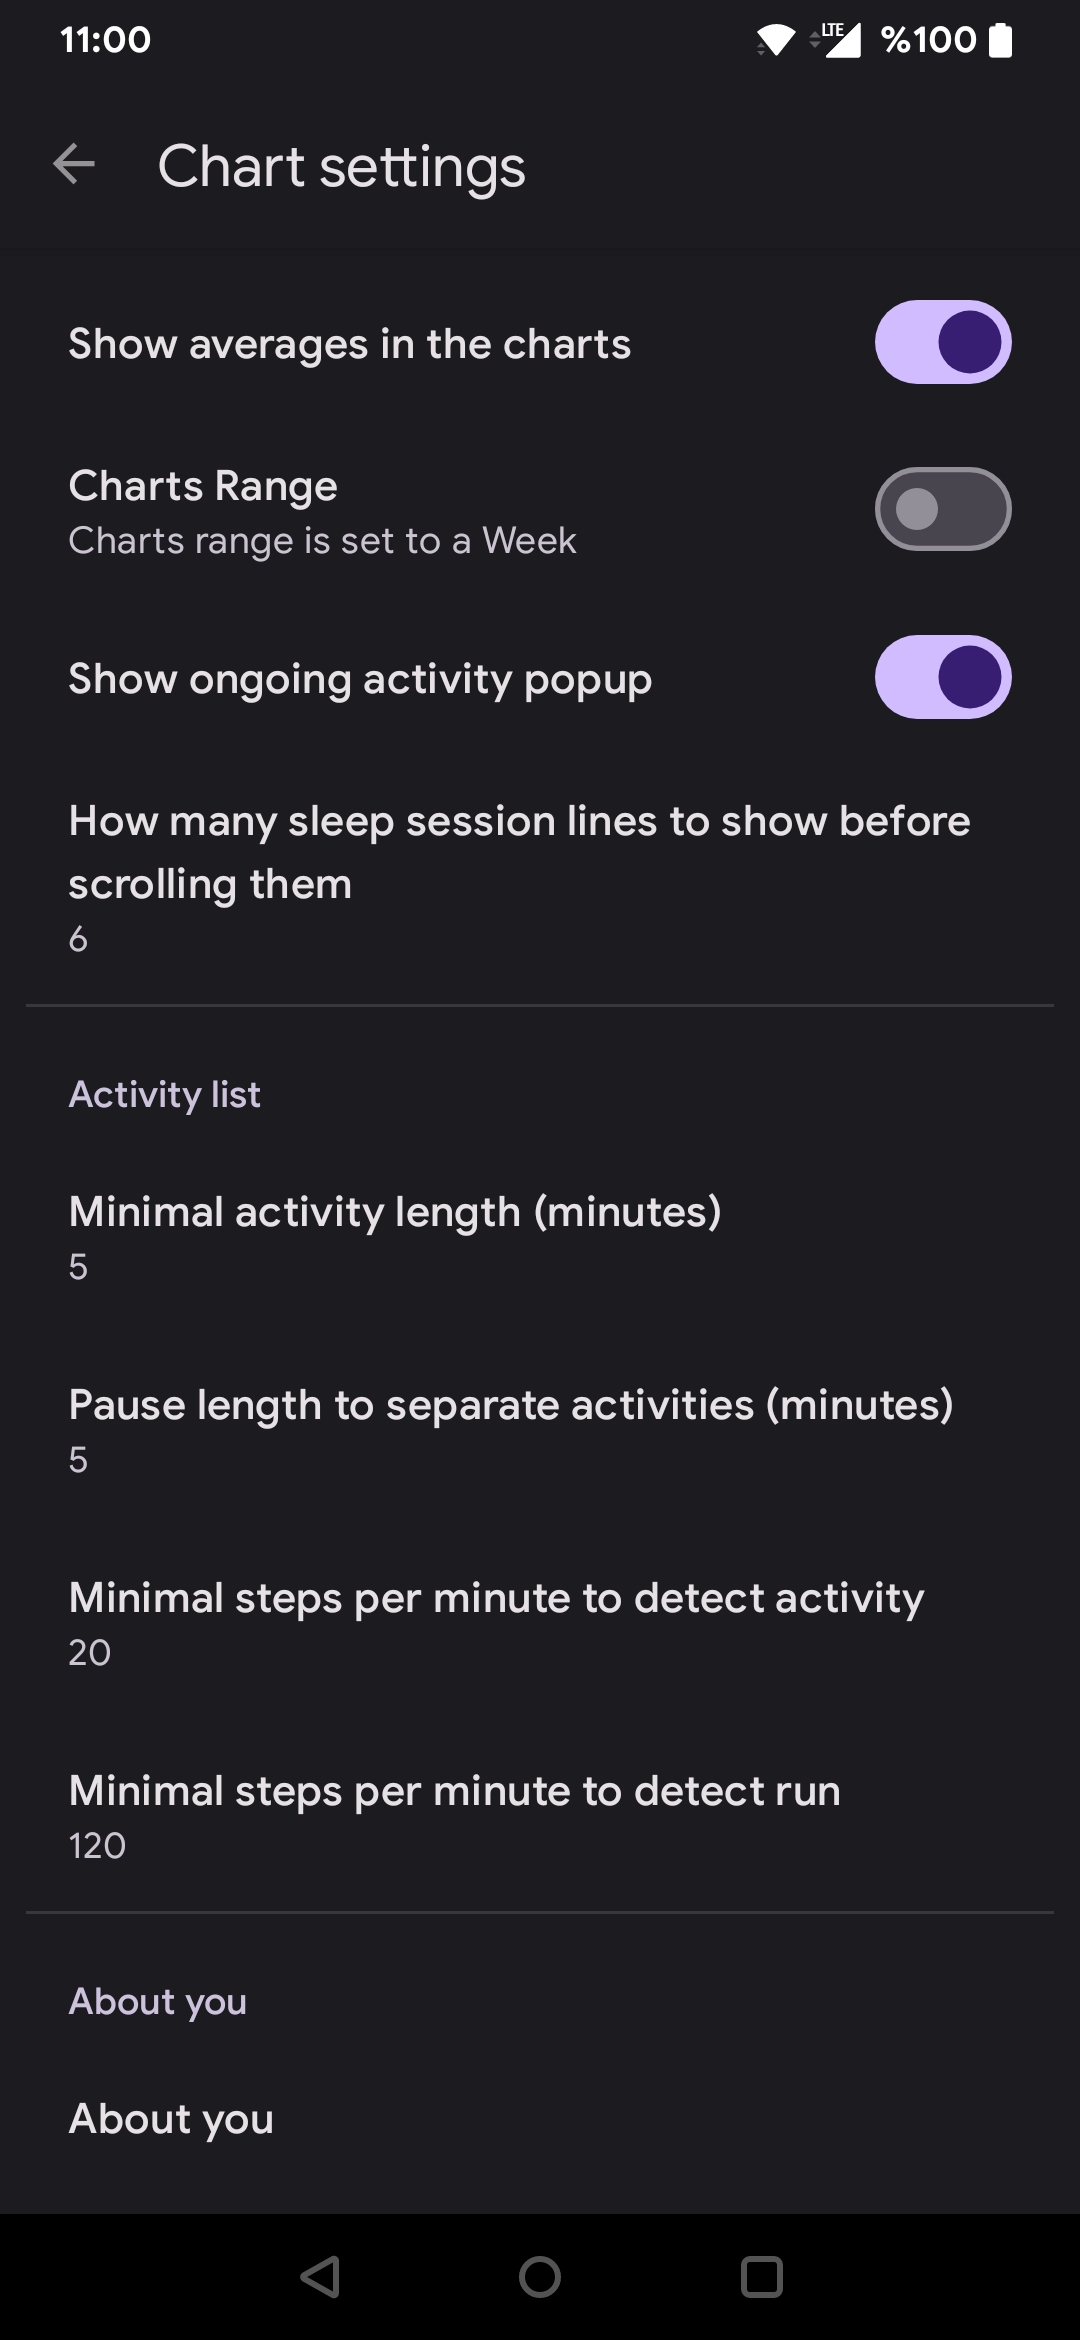
You can also change how activities are being detected, via Settings icon on top-right (while viewing charts), then scrolling down to "Activity list". Here are the determining factors:
- Activity session is detected by steps per minute or by activity intensity. The minimum steps per minute required for an activity to be detected as activity session can be set in "Minimal steps per minute to detect activity".
- Activity session must be at least X minutes long, this minimal duration can be set in "Minimal activity length".
- Activity session ends with a pause longer then a given interval, it can be set in "Pause length to split activities".
- Activity session is marked as "Running" if steps/m > 120, this can be set in "Minimal steps per minute to detect run".
- Activity session is marked as "Exercise" if it has less the 200 steps but has
heartRateAverage> 90 andintensity> 15.
To know how it is calculated behind the scenes, you can check out the StepAnalysis source code.
Sleep
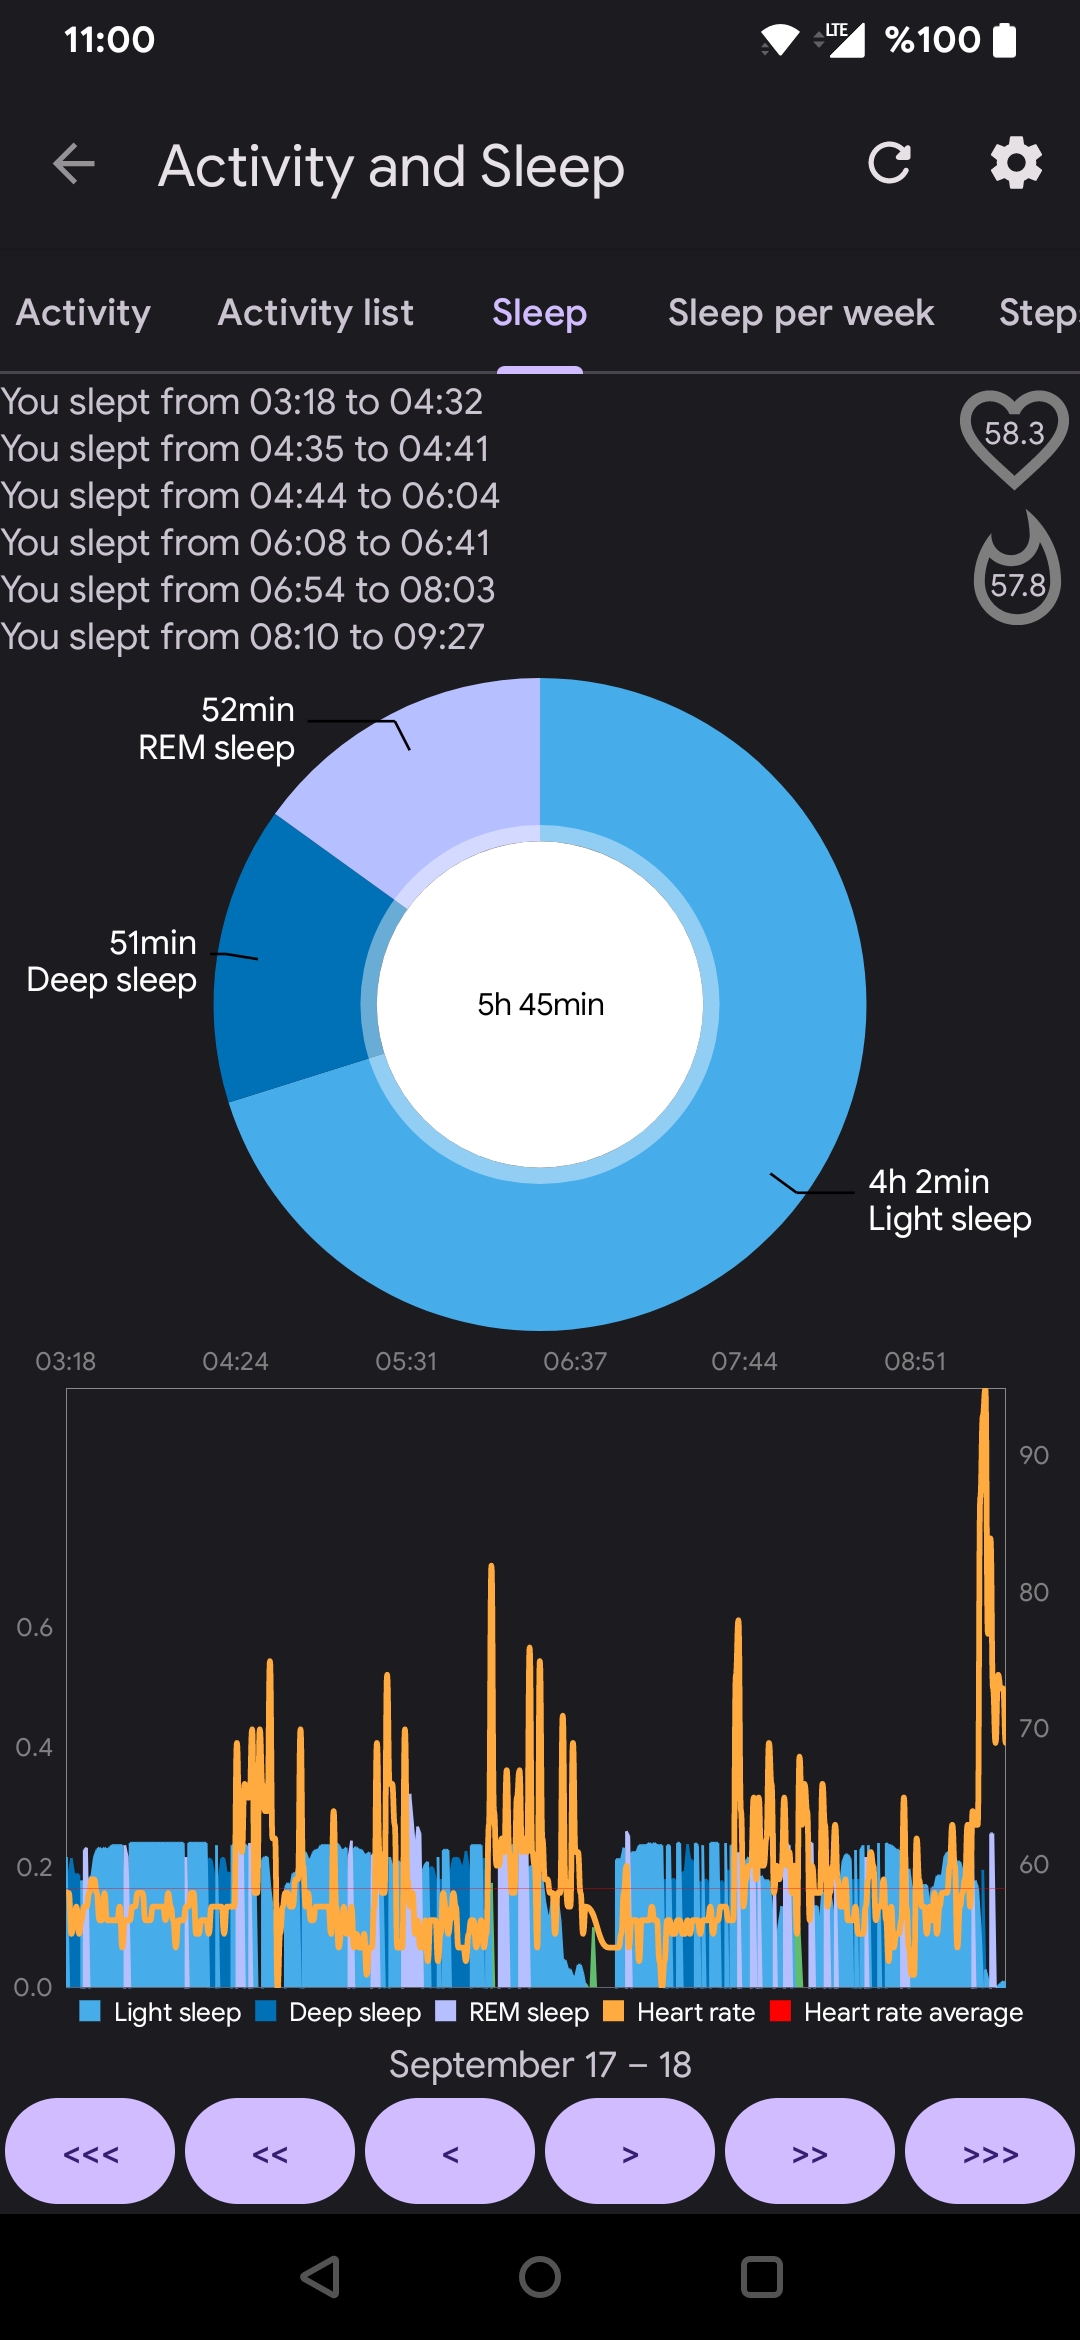
This tab shows sleep information just for the past night.
You can adjust the view interval to "Noon to noon" or "Past 24 hours". The circular chart shows light/deep sleep break down. Do note that for most watches, the deep sleep detection is not reliable. But, what you mostly care about is heart rate, often this can be enabled as "Continuous HR measurement" or "Improve sleep detection by using HR" in settings.
Minimum/maximum and average heart rate is displayed in the heart icon. Also, movement intensity (the blue lines on Y axis) is displayed as total for the night in the intensity icon.
Deep-sleep detection
There is no good Deep Sleep detection on Huami (e.g. Xiaomi and Amazfit) gadgets. This is an issue currently in ALL Huami gadgets, with the exception of VERY EARLY factory versions of the Amazfit Bip and older Mi Band 2 firmwares. issue #232
The reason is that the gadgets no longer properly distinguish between light and deep sleep but set some flags or hints for later analysis which is probably done in the Mi Fit app. The presumption is, that the Mi Fit app does some post processing on the data. Some work to analyze this has already been done, but no implementation has landed in Gadgetbridge. We would welcome a contribution in this direction.
So at the moment, we ignore these flags and hints completely, because despite of some theories and discussion, it is still unclear how all this works. This information still lands in the database, so if we fix the analysis one day it will retroactively work.
Having said that, the "Use heart rate sensor to improve sleep detection" works and you get good view into your heart rate during sleep.
Sleep per week
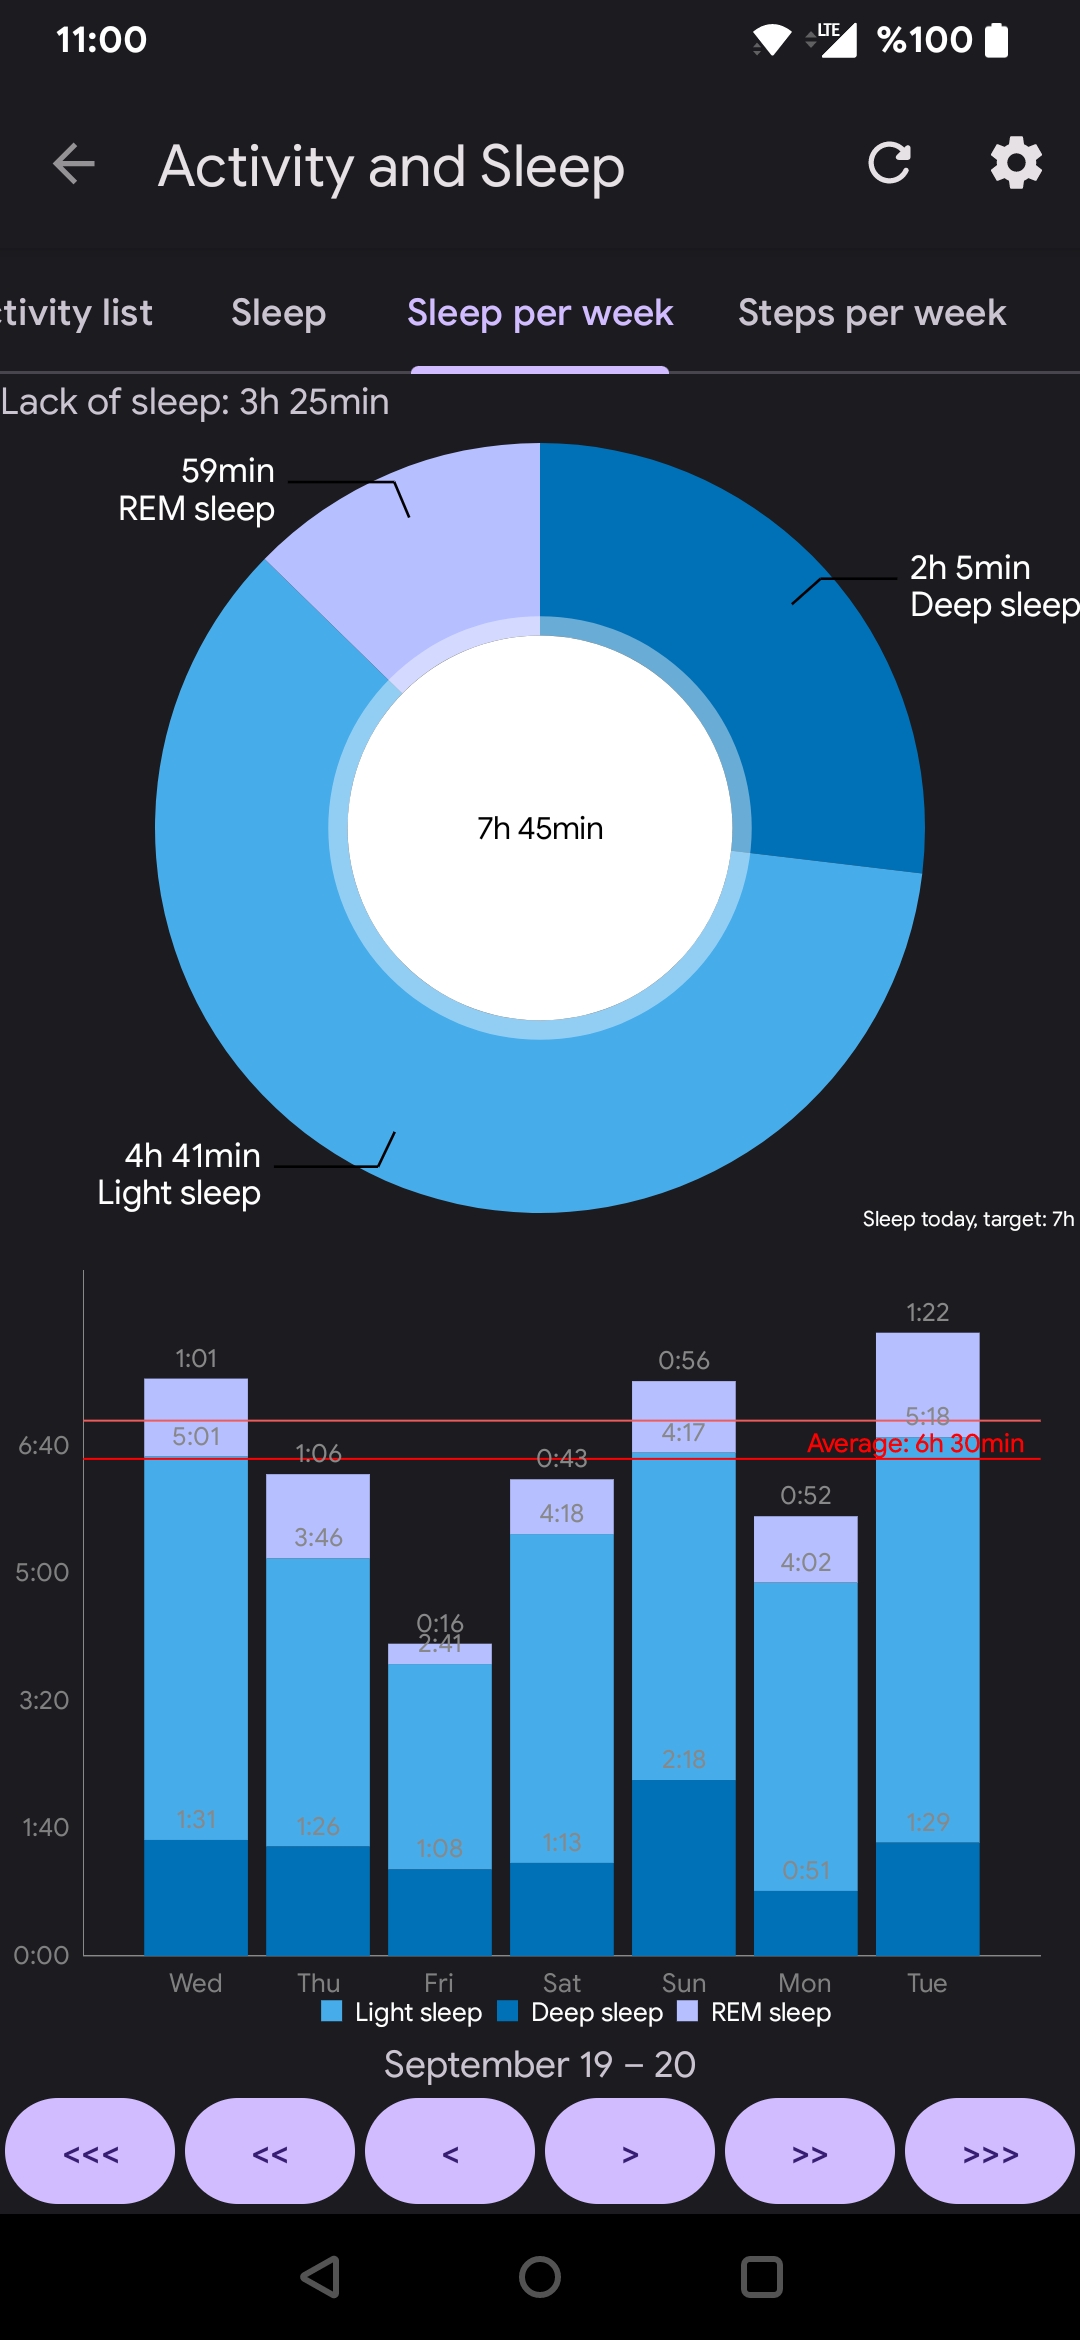
The Y axis shows light/deep sleep, make sure to add them up for total amount of sleep. Average and over/lack of sleep is displayed.
Steps
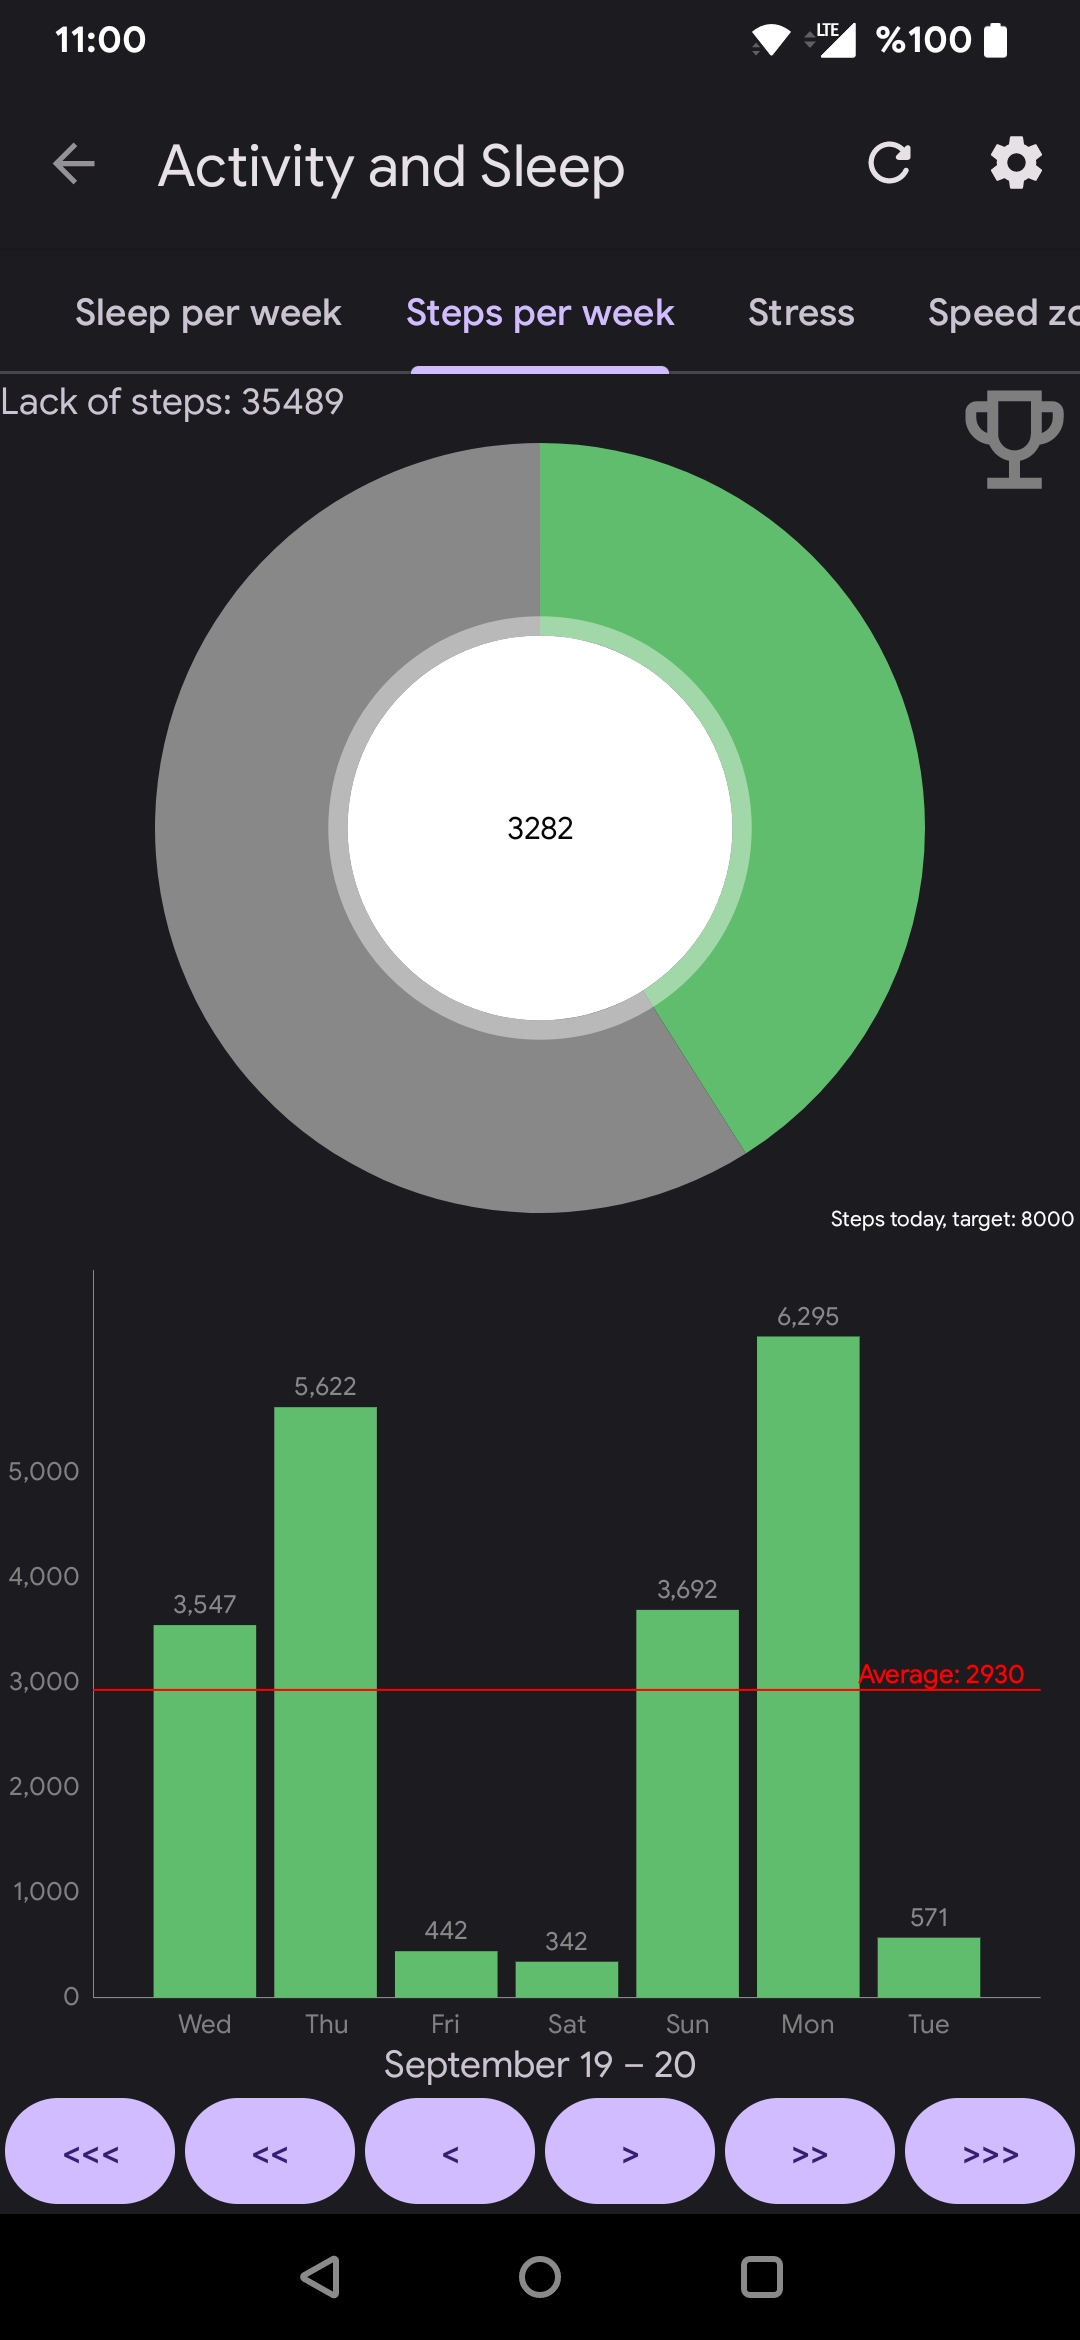
The Steps overview shows a graph with the detected steps per day. The X axis can display a week or a month, depending on what you have set in Settings → Charts Range.
On this screen you can tap on the Trophy icon to see your step streaks.
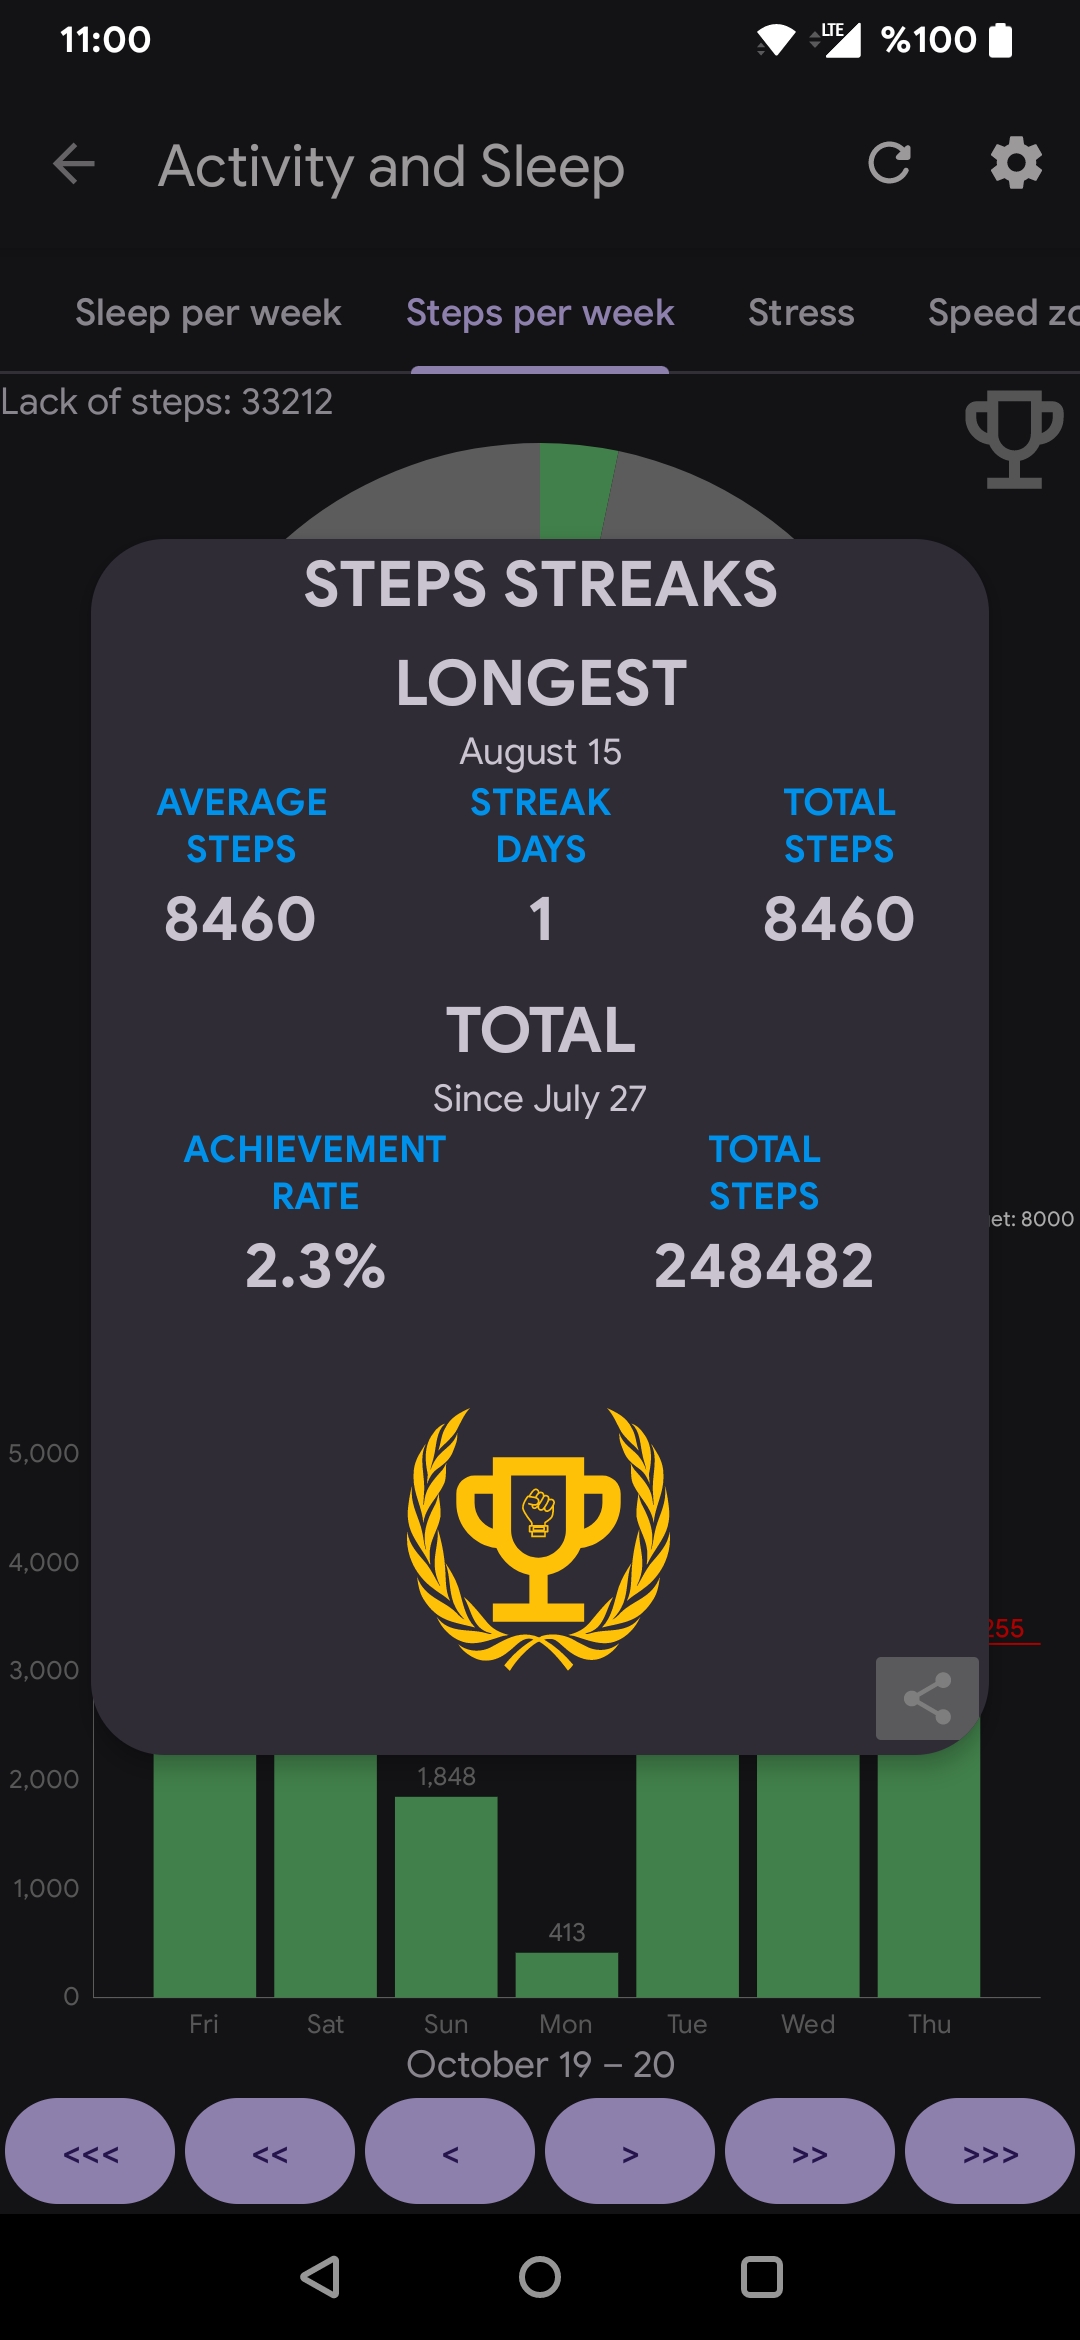
Steps streaks screen shows ongoing (if present), longest steps streak (series of days without interruption with the daily step goal reached) and also total statistics of daily goals success rate. You can use long press on some text elements to read more details, for example the total steps per day average.
By tapping the Share icon you can export and share an image with these statistics.
Stress
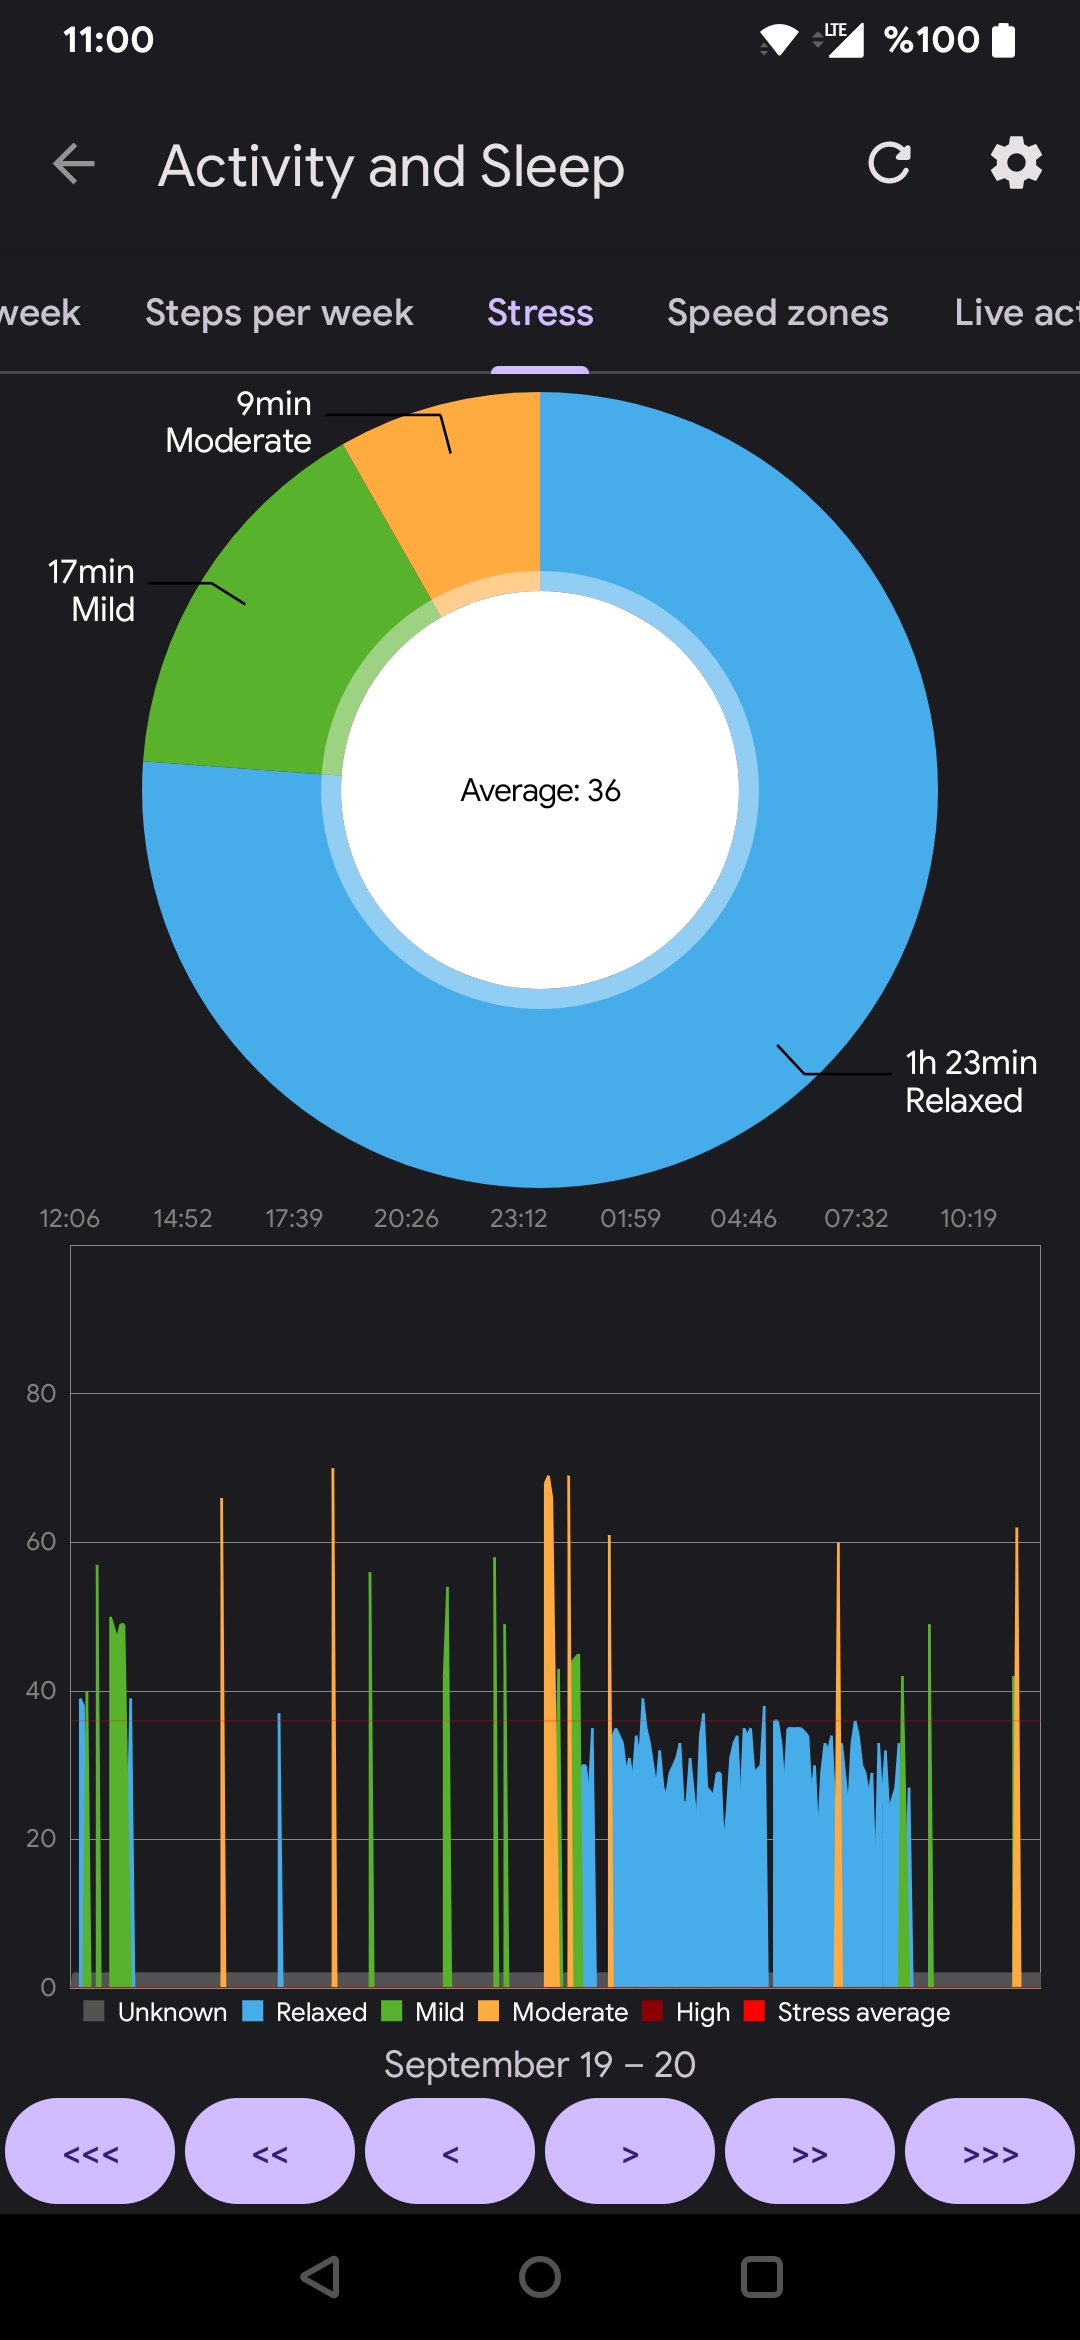
The stress screen provides with an overview of the stress levels during the day, as well as the average stress and breakdown of time for each stress level.
Intensity of an activity
One of the items in the activity list but also in the sleep chart is intensity which is indicated with a Fire icon.
It is an interesting value which typically does not surface as a number, but in fact it has been used throughout Gadgetbridge charts a lot: the green spikes on axis Y in activity charts? Intensity. The light and dark blue spikes on axis Y in your sleep charts? Also intensity.
It is a value (normalized to decimal between 0 and 1) that is representing a strength or an intensity of your activity, as determined by the bracelet. At night, the more you move, the higher this intensity is. During an activity or walk, the more your arm moves, the number seems to go up. So it seems good to expose this number even more, to be able to observe it, typically labeling it as "Movement intensity". The displayed result is not calculated as an average but rather as a total sum of the intensity of a particular activity in activity list or in your sleep. Hopefully you'll find it useful.
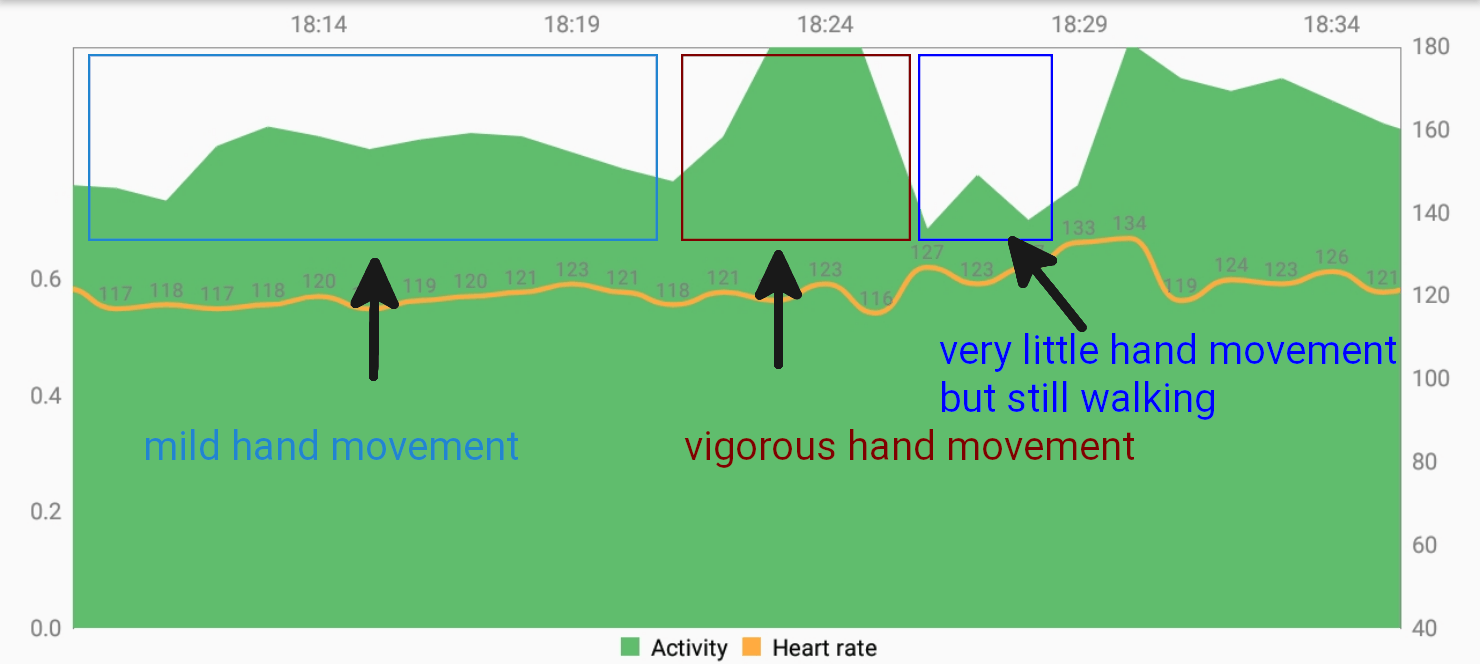 A graph explaining movement intensity
Manage charts
You can change the visibility of activity charts and reorder them as you wish.
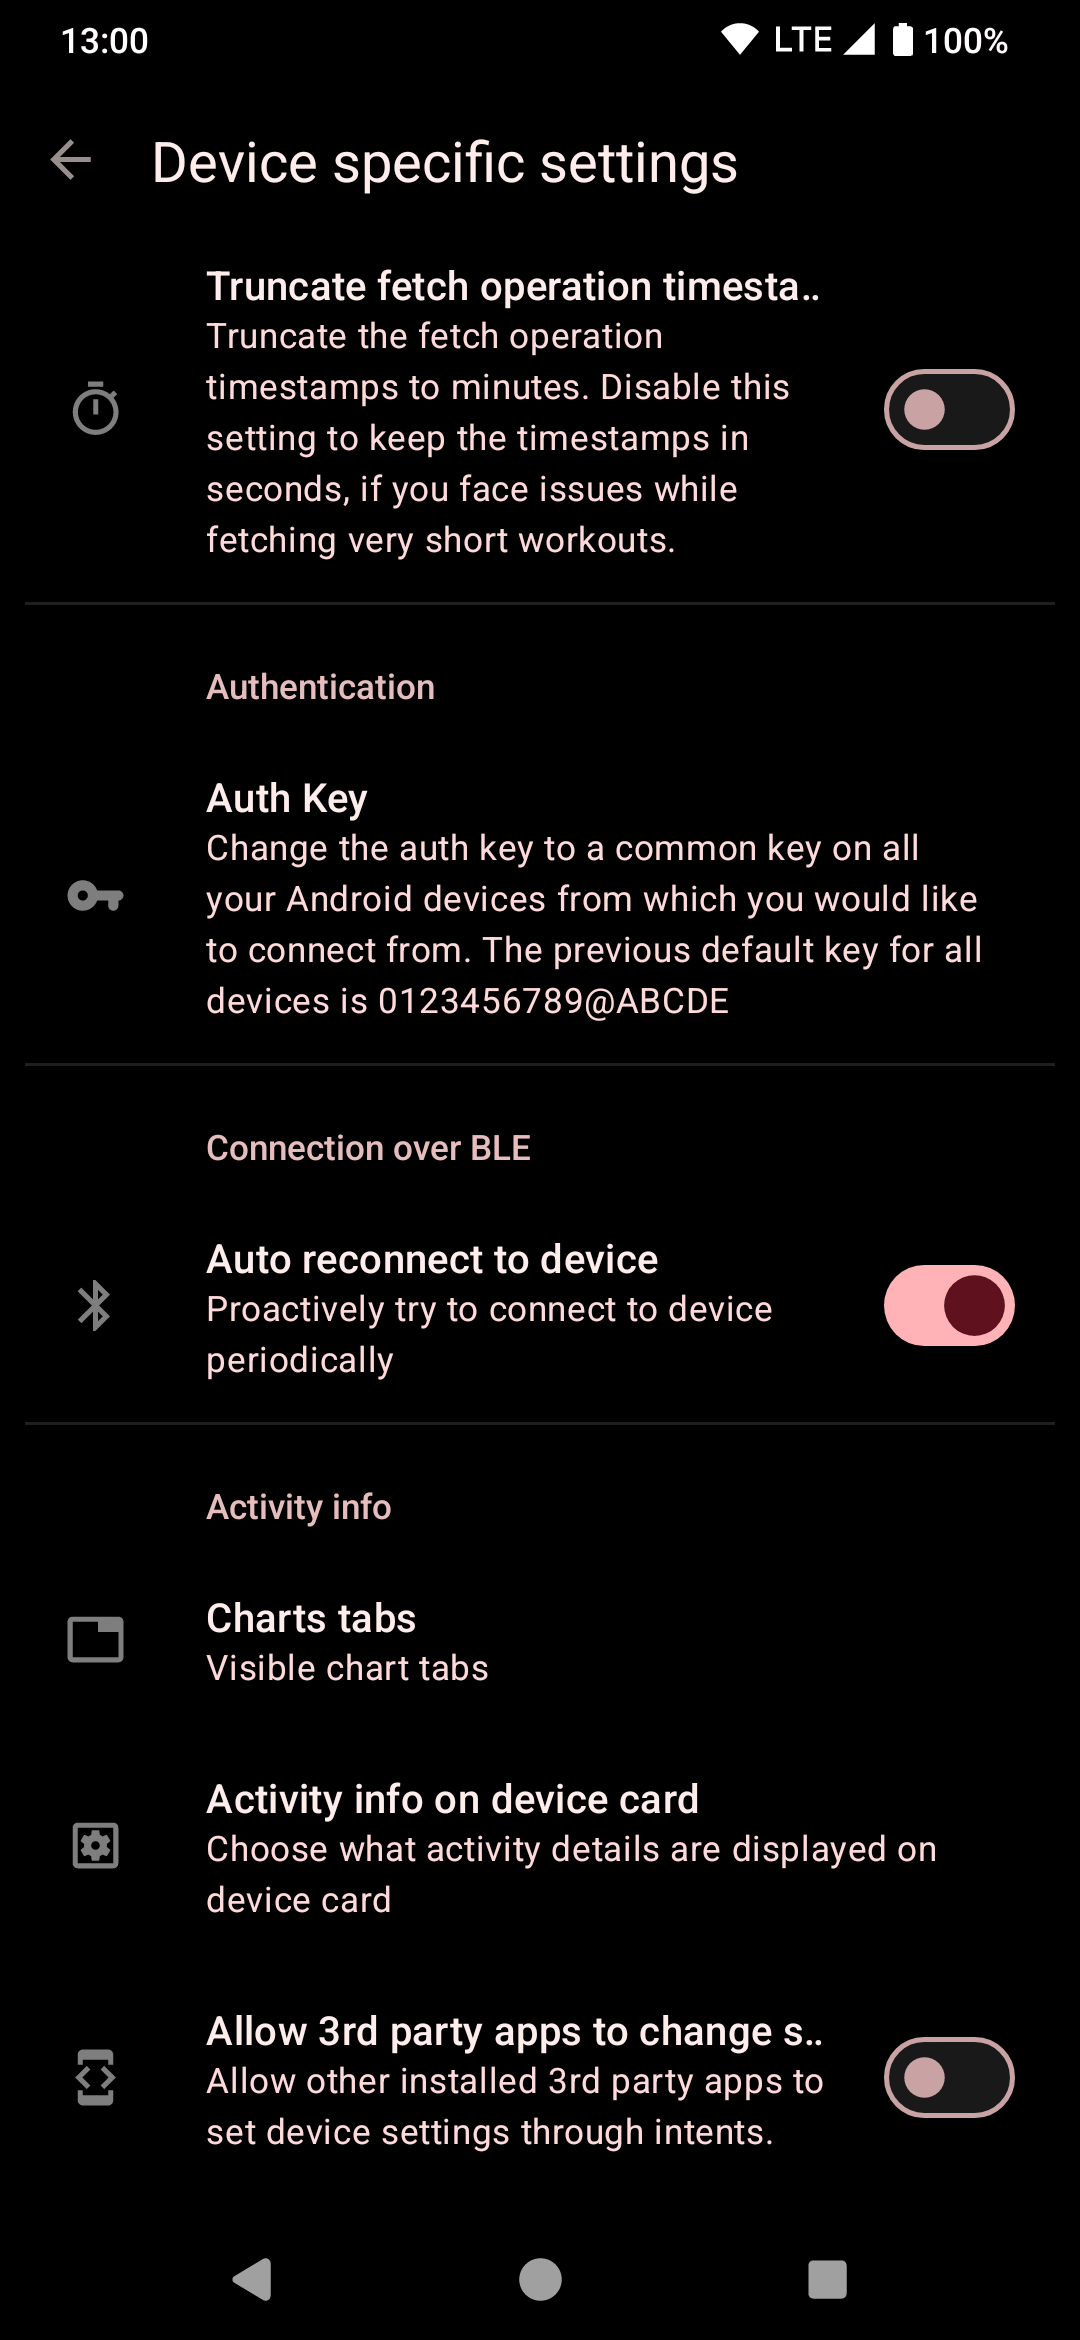
If you are not currently in the device specific settings screen already, tap the Settings icon under your gadget name to access the "Device specific settings".
Then, scroll all the way down and click on "Charts tabs" at the bottom.
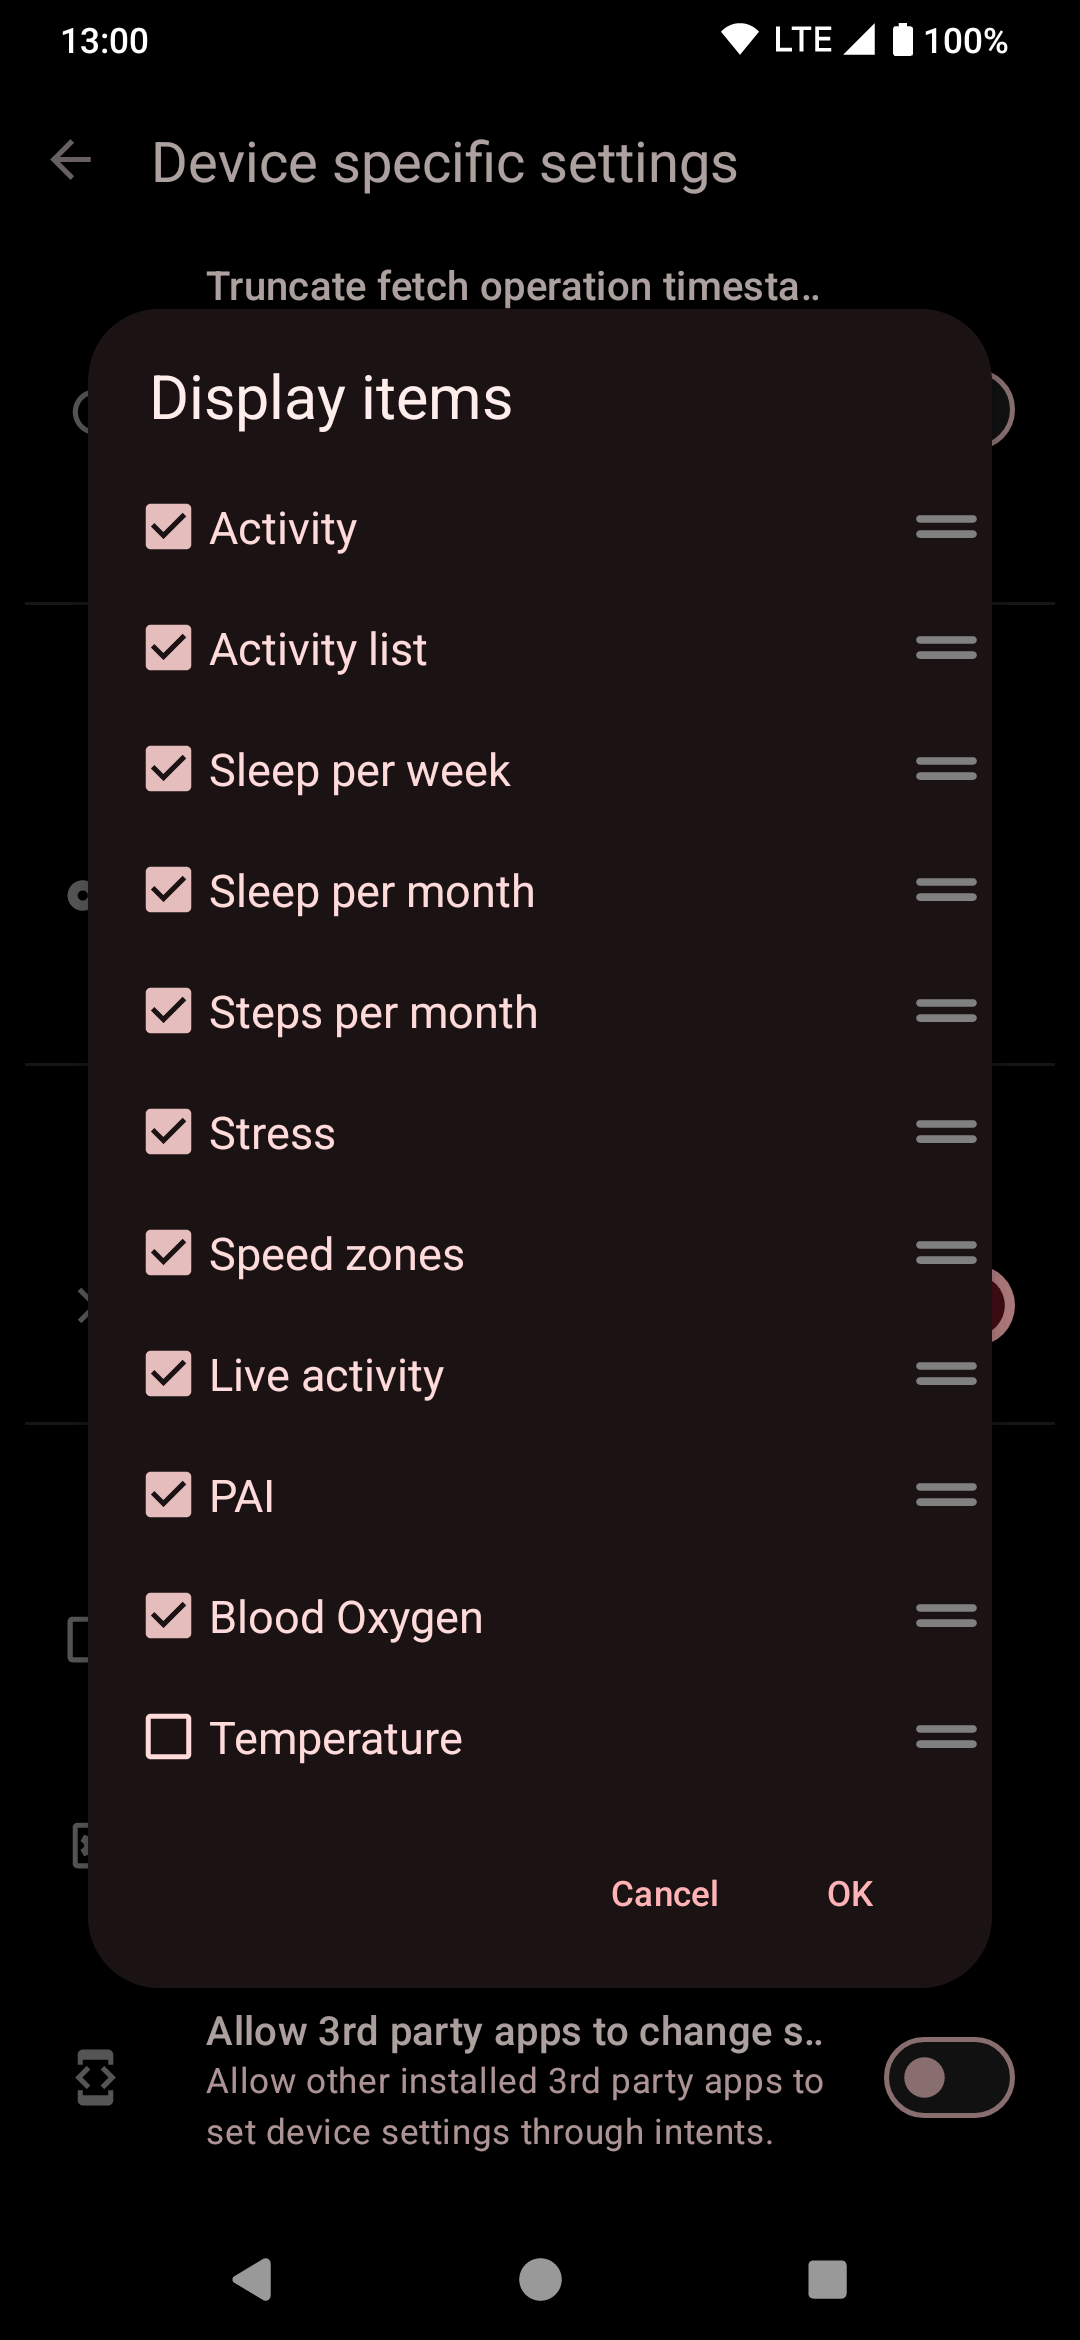
Now you can reorder (by dragging items) and set visibility (by checking the checkbox) of chart tabs.
When done, click "OK" to save.
By disabling charts tabs that aren't interesting to you or aren't supported by your device, you can clean up the interface a bit by making it show only relevant information.